

Introducing Control Health: visibility into how controls run
When you set up controls in Impero, you're designing how they should run. But the ideal setup isn't always how they actually run in reality.
The status of your control tells you where it is right now – in progress, waiting on a reviewer, completed. What it doesn't tell you is how it got there. Did it sail straight through, or was it rejected twice, reopened for changes, and left sitting overdue while everyone waited on someone else?
Today, we're introducing Control Health – a new way to see not just where a control activity is, but how smoothly it's getting there.
Why a status isn't the full picture
Two activities can both end up marked "completed" and have gotten there in completely different ways. One ran cleanly. The other was rejected, reopened, chased with reminders, and finished late. From the status alone, they look identical.
That gap creates a few familiar headaches:
- Activities get stuck waiting on a reviewer and quietly slip overdue, with nothing surfacing it until it's already late.
- Activities get rejected or reopened when a control wasn't clearly formulated or the work wasn't performed well, and you don't catch the pattern in time to fix it.
- Getting a real picture of how your controls are running means piecing together scattered inputs by hand, usually long after the moment to act has passed.
Control Health closes that gap.
What is Control Health?
Control Health is a new feature in the Impero platform that goes further than completion. Instead of only telling you whether a control activity finished, it shows you how it ran – flagging friction so you can take action, and giving you a view of how efficiently your controls have been performing over time.
It has two connected parts: a health indicator on every activity, and a full activity timeline behind it.
A health column next to every status
The Control Activities list now includes a health column alongside familiar ones like Status and Reviewer. Each cell tells you at a glance: its friction level.
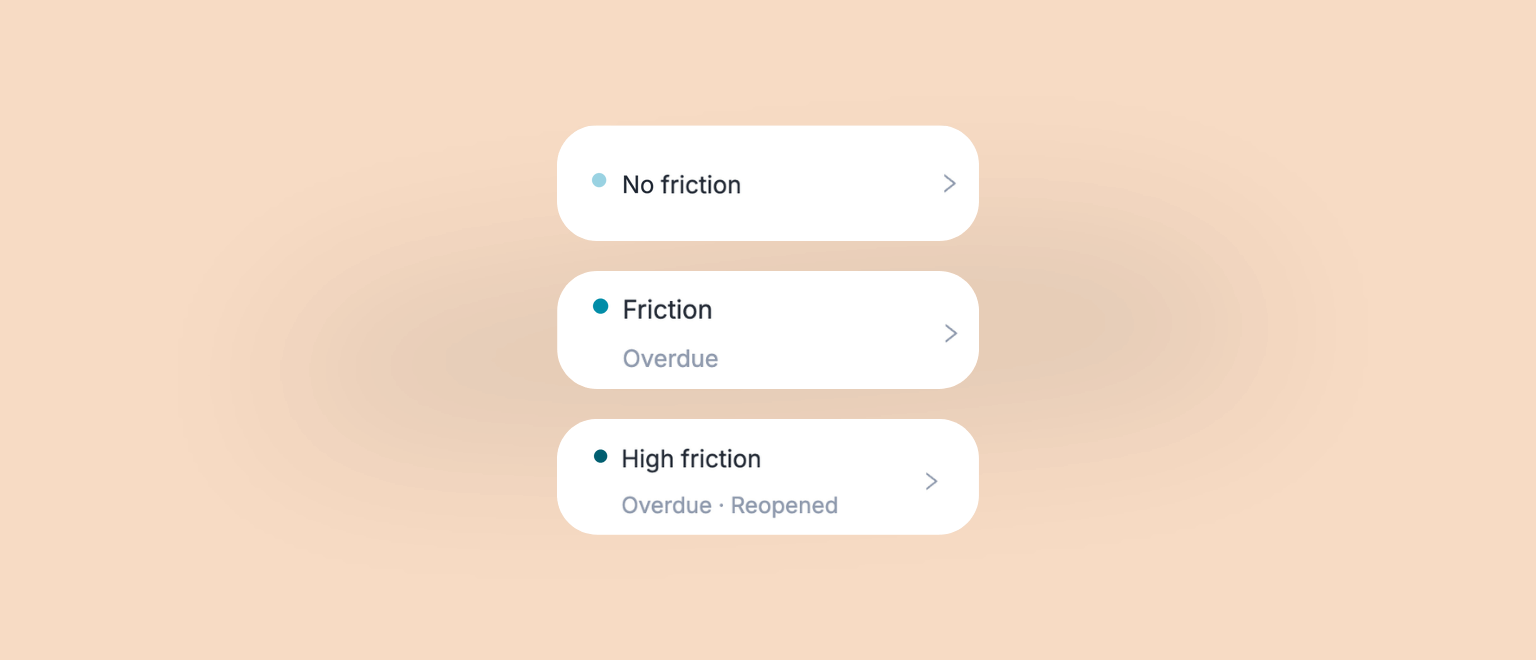
The health column determines friction level by evaluating each activity across two independent dimensions: quality (rejections and reopens) and punctuality (whether it was completed on time). The friction level reflects how many dimensions are affected:
- Clean (green) – neither dimension is affected. The activity moved through its lifecycle smoothly.
- Friction (orange) – one dimension is affected. For example, an activity that ran overdue, or one that was rejected during review.
- High friction (red) – both dimensions are affected. For example, an activity that ran overdue and had rejections along the way.
Control Health flags these events from an objective perspective. For example, rejections might indicate rigorous QA in one team and a workflow problem in another. Control Health surfaces the signal; you decide what it means for your operations.
Each cell shows the contributing events underneath the label, so you're never guessing why – for example, "Overdue · Rejected 2×." In-progress activities are assessed too, so friction surfaces before an activity is finished, not only in hindsight.
Because Health is a column like any other, you can sort by it to float problem activities to the top, filter to see only Friction or High friction activities, and show or hide it via Adjust View to suit how you work.
Where the status tells you where an activity is now, Health tells you whether it got there smoothly.

The full activity timeline
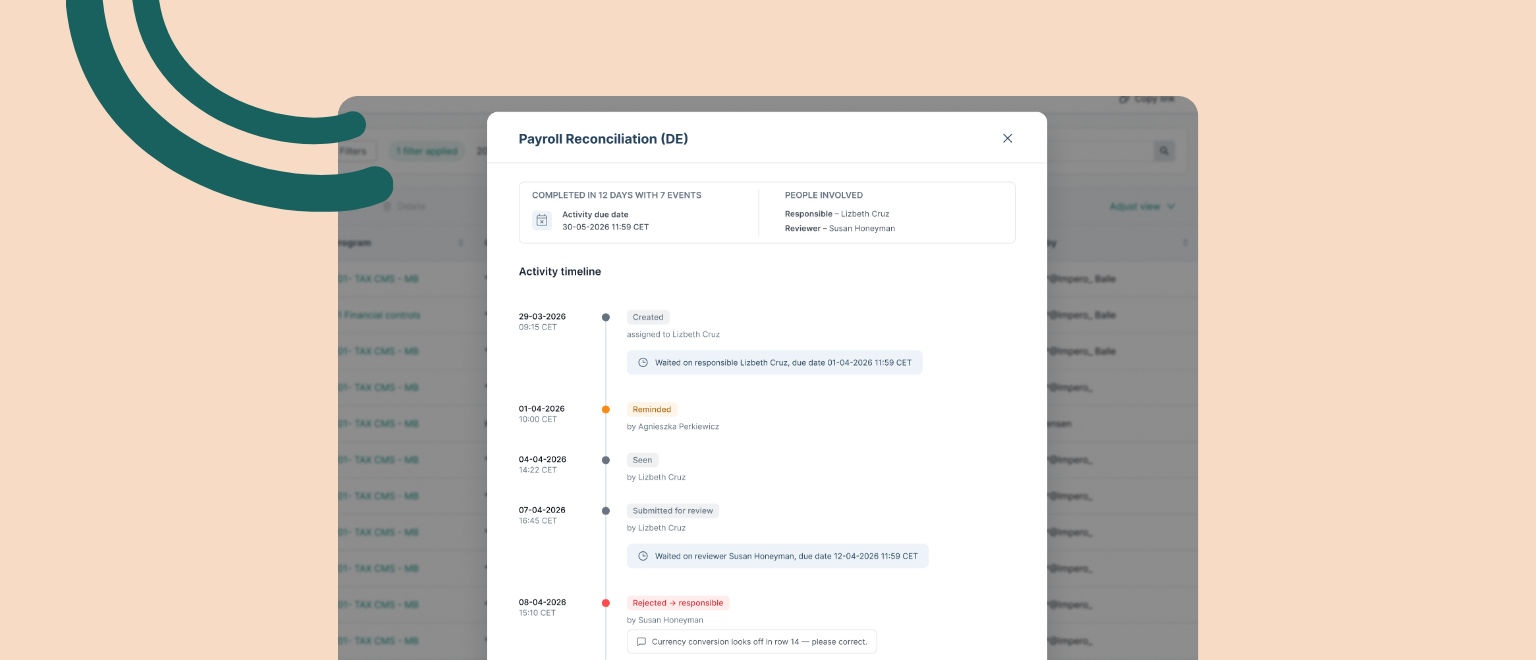
Click an activity's health cell and its timeline opens in a modal, right there in the list, so you can read the full story without navigating away.
The timeline records every meaningful event in chronological order, each with a timestamp and the person behind it: when the activity was created and assigned, who has viewed it, who submitted, approved, rejected, or reopened it, and every reminder sent, whether automatic or manual.
A summary box at the top sets the scene at a glance, for example "Open for 8 months with 6 events," along with the activity's due date and the people involved. Alongside the events, "Waiting on" boxes show who the activity was waiting on at each stage and the due date they were working to – and turn orange when a step ran past its due date. That's what makes bottlenecks obvious: you can see that an activity sat overdue while waiting on a particular reviewer, and know exactly where to follow up.
The Health dashboard
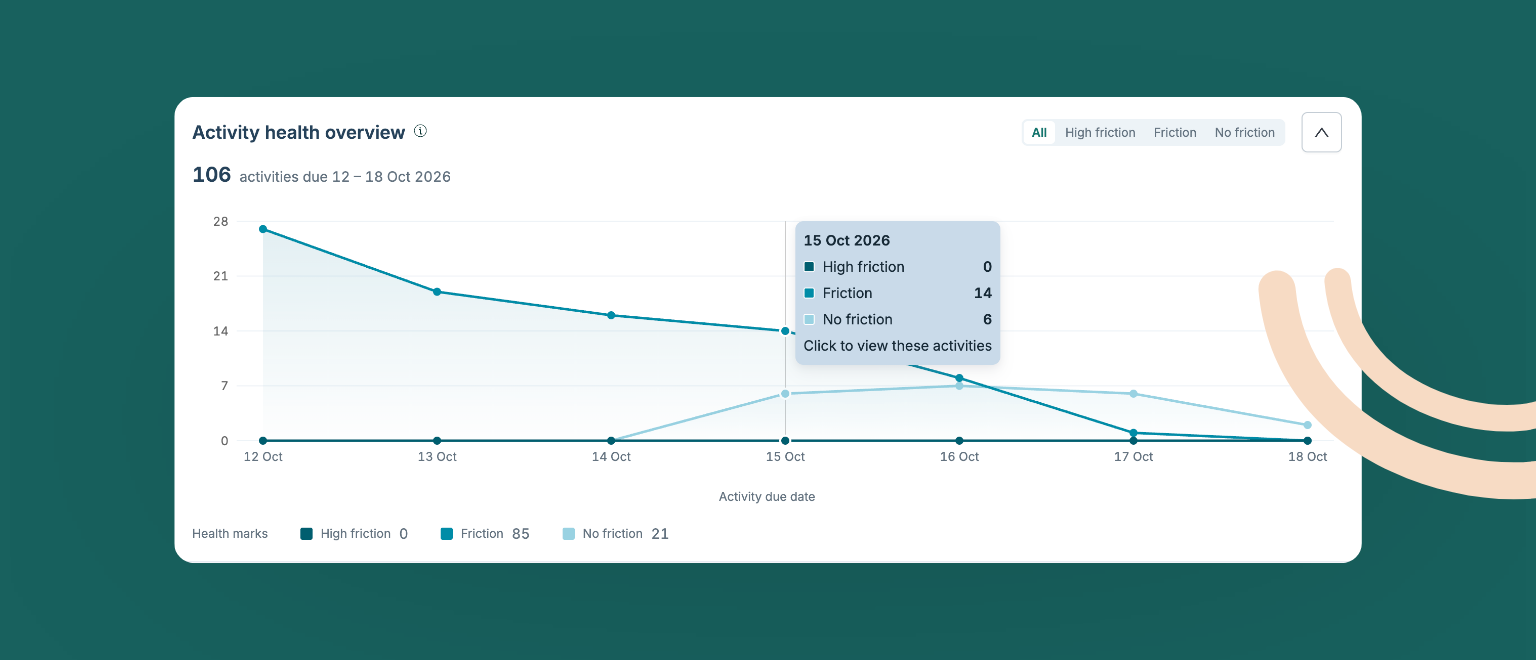
The health column and timeline show you one activity at a time. The Health dashboard zooms out to your whole control portfolio, so you can see how things are running across programs and over time. You’ll find it on the new Health tab of your Dashboard. It reads from the top down, from the overall trend to the work that needs action now:
- Activity health overview – how Clean, Friction and High friction activities have trended across the period, so you can spot a difficult month or confirm that a change you made is working.
- Friction breakdown – what kind of friction you’re seeing, split into overdue, rejected and reopened. A lot of overdue usually points to timing or workload; a lot of rejections or reopens usually points to quality, like unclear instructions or missing evidence.
- Status breakdown of ongoing activities – where work is stuck right now: which programs have overdue activities, how late they are, and whether they’re waiting on the responsible, a reviewer or a second reviewer.
Filter by due date range (anything from the current week to a full year, or a custom period), program, tag or entity, and every chart and table updates together. Click any number to open the activities behind it, whether you’re running a quick weekly check on what’s overdue, reviewing last month’s friction, or pulling a past quarter together for an audit.
Why it matters
Control Health means less time piecing the picture together by hand, and more time actually improving how your controls run.
- Friction becomes visible. You can spot what needs attention at a glance, and act on it before a small delay becomes a bigger problem.
- Patterns surface earlier. Repeated rejections or reopens point you toward controls that may need rewording or reassignment.
- You get a view of efficiency over time, not just a snapshot of completion – a clearer sense of how well your control environment is really performing.
Getting started
Control Health is available to all Impero customers now. The health column and activity timeline arrived on September 2, and the Health dashboard followed on October 20. No enablement is needed. Log in and you’ll find the health column in your activities table and the dashboard under Dashboard › Health.
We’ll keep building on Control Health based on how you use it and what you tell us you need.
Want a live walkthrough? Check out our dedicated tutorial.
For the full details, see the release notes in the Impero Help Center.
Get the latest from Impero in your inbox.
Stay informed on all things Impero — webinar & event invites, exclusive content, product launches, and more! Or let us show you why Impero is the right choice for your risk and compliance needs.

You might also like...
Explore insights, product updates, and practical guidance to navigate the world of risk & internal controls.